Student GIS Projects

I’ve been teaching the Introduction to Geographic Information Systems (GIS) class in the Earth, Environmental, and Sustainability Sciences (EESS) Department for about 11 years. Suresh Muthukrishnan (department chair) also teaches the course. I’ve learned a ton from him. Here are some things I really enjoy about teaching the course:

House flipping hotspots near the Cincinnati Streetcar route. An example map from student Charlotte Moore.
  • Interdisciplinary Nature – Students from across campus take the course. Of course, there are lots of EESS majors. However, even those projects run the gamut. Projects like geologic mapping, landslide risk, sustainable farming, and even mapping data from GPS collars on mountain lions. But students of history, economics, sociology, computer science, business, and music also come up with some great projects.
  • The Opportunity to Learn – Every semester, students will come up with novel questions and methods. I think my typical response is, “I haven’t done that before, but I know it’s possible. Let’s figure it out together.” So I learn something new about GIS, as well as all the topics above, each time I teach.
  • Community Connections – Many of the projects involve community partners–folks like the Greer Police Department, Upstate Warrior Solution (which serves veterans), Greenlink (our public transportation department), local land conservation non-profits, the forestry department, and community associations. Our first deep partnership involved mapping streetlights, which I’ll talk about in another post.
  • Working with Our Post-Baccalaureate Fellows (postbacs) – I’m grateful to get to work with two recent Furman graduates who are on our team. Catherine Lippert (Sustainability Science) and Sam Hayes (History and Politics and International Affairs) are an integral part of teaching the course. They have serious GIS chops and roll up their sleeves to help the students with projects, every step of the way.
  • Project-Based Learning – The course involves a semester-long project. It’s a real challenge to teach GIS principles, create meaningful labs, AND support students as they use these concepts and tools to apply what they’ve learned to address a real-world problem. Every semester I think, “We took on too much. This isn’t going to happen.” But it always comes together. Here’s the syllabus for the class.
An historic, georeferenced map of Charleston Harbor (1711). From a student project by Kylie Gambrill.

Here are some examples from a recent class. I don’t want to make it seem like I’m taking credit for these. The students did the work. Catherine, Sam, and I were teammates. However, the examples are illustrative of the range of projects that are possible. The projects are easier to share, now that we have switched the delivery format from poster presentations to StoryMaps.

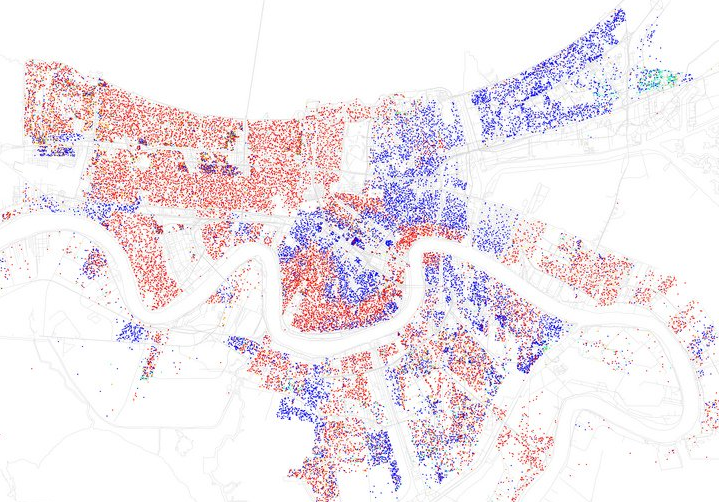
Charlotte Moore: Transit-Motivated Gentrification: An analysis of gentrification in Over-the-Rhine, especially as a result of the Cincinnati Streetcar.

Caroline Vickery: Contextualizing Upstate Farms: A preliminary examination of land use and nutrient loading for small farms in the Upstate of South Carolina.

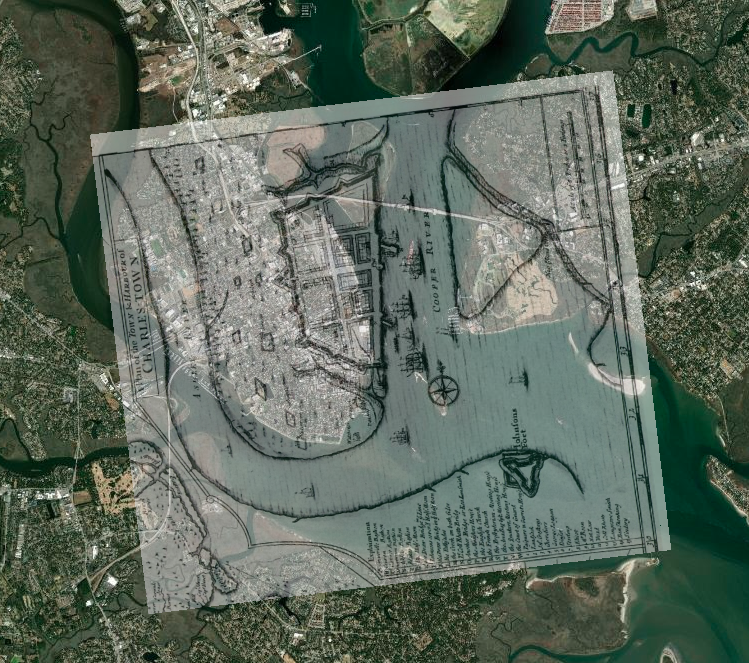
Kylie Gambrill: Understanding Change: The Charleston Harbor — Our perceptions of the environment around us depend upon the cultural context we find ourselves in.

Bennett Dean: Affordable housing and public transportation in Greenville.

 Chloe Sandifer-Stech: Recommendations for green space around Enoree Career Center: A study of the influence of tree density on carbon storage.

Jake Gerardi: Land Sparing/Sharing Impacts on Birds: Assessing habitat quality of southern bird species using ecological principles in Greenville watersheds.

Madison Eichhorn: Affordable Housing & Good Jobs – An evaluation of proximity, density, and availability of affordable housing and employment.

Austyn Feigenbaum: Boating Safety Zones and Florida Manatees: An investigation on the relationship between manatee death rates and boating safety zones along the coast of Florida.

I hope you’ve enjoyed seeing the range of student projects and learning more. It’s a pleasure to see all the hard work result in such great studies and stories.

Reflecting on Projects

Partnership with United Way of Greenville County: Neighborhood Assessment

Percent Unemployment: Greenville County and Ten Focus Neighborhoods.

I’ve been going through the course, Visualization for Clarity, on the FlowingData website. I’ve learned a great deal and decided to use it as an opportunity to go back through previous work and projects to analyze what we did right and what we could have done differently. 

  1. Firstly, I wanted to put highlights from the projects in one place. Some of these resources are difficult to find. So I wanted to pull them together in one place. So that’s a question for action: How do we make our work easier to find, so that the information can be leveraged for positive change? See the full report and executive summary for details on this project.
  2. I hope this exercise will prompt me to reflect on our work. I say ‘our’ because almost all of the work I’ve done has been with teams. Although I like to hole up and make maps and other visualizations myself (usually playing punk music and drinking homemade cold-brew coffee), I love working in teams. Part of it is selfish; I just learn so much by working with others.
  3. The last reason is professional. It’s difficult to share this kind of work in a CV/Resume. I want to get it out there–get feedback from a broader audience and connect more deeply with a GIS / DataViz community.

So here’s one from the recent past.

Project Title: Focused Needs and Assets Assessment – Greenville County, SC

Team members: See the list in the report. It was a big, team effort. 

Violent Crime in Ten Study Neighborhoods: Data from Greenville Police Department.

Summary: 

  • We focused on 10 neighborhoods with the highest family poverty rates in Greenville County. This focus was determined in collaboration with the United Way of Greenville County. 
  • We then sent teams of qualitative researchers, including students, into these neighborhoods to better understand assets and needs. That team met with 268 neighborhood stakeholders! We wanted to make sure to focus on assets just as much, or more, than needs. As you can probably guess, these varied greatly from neighborhood to neighborhood.
  • Our team mapped and graphed 35 measures of community well-being, highlighting each of the ten neighborhoods. 
  • Because of United Way’s focus on a cycle of success, particularly third-grade reading scores, our team re-aggregated the data to local school attendance zones to analyze explanatory variables for reading scores. See the full report or executive summary. The most interesting one to me was the potential role in communities with high alternative workshift rates (e.g., second-shift, third-shift, etc.). Professor John Quinn took the lead on this analysis. 

Tools used for visualizations, maps, and modeling:

  • ArcGIS Desktop
  • QGIS
  • R
  • Tableau
Financial Measures Broken Down by Neighborhood and Tract Number. Darker Green Shows Higher Percentage or Dollar Amount.

Visualization Reflection:

The good

  • I think we did a great job with maps and visuals, e.g., color choices, visual hierarchy, highlighting local landmarks, and other map-making best practices.
  • I also like the tables for the measures of well-being (see above). Sometimes tables are better than a fancy visualization. This is a good example. The color shading in the table really draws the eye towards certain neighborhoods.
  • I really like the asset and need visualizations in the executive summary (see below). This was Dr. Matt Cohen’s idea. We implemented that with Tableau.
Community Assets. Identified by Community Members and Stakeholders.

Opportunities for Improvement:

  • Interactivity – It drives me a bit crazy when great information isn’t interactive. We locked this into PDF format for the report. In our defense, we had limited time and budget, so we decided not to pursue interactive platforms like Tableau Server and ArcGIS Online. We fixed that in future projects. How cool would it have been to have to be able to hover over a particular neighborhood and see it highlighted in our box and whisker plot? I could do that in Tableau Desktop, but it would have been helpful for our stakeholders to do that too. 
  • Updatability – We put a lot of work into pulling data in tabular form, cleaning it up, re-aggregating it to non-standard boundaries. Now the data is stale. We need to take a step back and explore ways to develop frameworks that allow us to “slide” new data underneath (like new ACS estimates) and have maps and graphs auto-update.

An unplanned semester online:

Like my students, I’m struggling with the shift to online. I’ve used screencasts (short recorded lectures) previously, but I’m re-evaluating. I like them because they are a compact way of sharing content and context. Most are in the 7 – 20 minute range. But here are the challenges:

1. Time to produce – I know it’s hard to believe, but this one took me about 4 hours to a) get the data wrangled 2) put together an outline 3) record, and 4) edit. So I, either suck at this, or my experience is indicative of other instructors’ experience. I’m open to the former.

https://furman.box.com/s/no1ui4cwbwnrud6vuqm02q10kk1zrppm

2. Time in-class vs. online lecture – This would have taken 2x the time to discuss in class. The presentation wouldn’t have been as tight, and student questions/discussions would have extended the time. But is that “time gain” a good thing, or indicative that something is missing online?

3. Lecturing to no one – You might hear it in my voice, but it’s hard to lecture to an imagined audience. I try to envision my students, and I’ve even stood up to produce the screencast with more energy, but recreating the in-person experience is tough. I miss them.

4. The long term – I think I can use these screencasts, which are primarily information dissemination and demonstrations, to make space in my class for more interaction and discussion. However, that’s going to have to happen in person, or it’s one more thing to figure out how to do online. Zoom breakout groups are great, but are they the same thing as in-person discussions?

Some questions:

  1. Do you find that developing screencasts is worth the time?
  2. A similar, live lecture via Zoom is going to take longer, but is the interactivity worth it?
  3. How do you use short screencasts to make room for my interactivity during synchronous meetings, whether online or in-person?
  4. What went well online this semester? What were the challenges?


Lessons from 1918

After reading this article about how different cities handled the 1918-19 flu pandemic, I decided to get the data graph it. You can see the impact, and the result of St. Louis and San Francisco letting their guard down too early—despite stronger responses in the early phases.  It appears SF likely overestimated the effectiveness of masks in preventing the spread of this particular virus.

I realize the that virus and Covid-19 are different, but perhaps there’s still a lesson to be learned from history.

Philadelphia (1918) – It’s just like the regular flu. Just keep your feet dry and your bowels open. We’re not canceling the parade.

St. Louis (1918) – This is serious. Avoid crowds. Treat people in their homes if possible. Act early.

San Francisco (1918) – This is serious. Implement social distancing. Wear masks.  

Data source below:

Collins, S. D., Frost, W. H., Gover, M., & Sydenstricker, E. (1930). Mortality from influenza and pneumonia in 50 large cities of the United States, 1910-1929. Ann Arbor, Michigan: Michigan Publishing, University Library, University of Michigan.

GIS and Social Justice

At a recent faculty gathering on community engagement, I was asked to provide some examples of how Geographic Information Systems (GIS) is being used to support different social justice initiatives. While there are many examples, I didn’t have much time to share, so I highlighted just a few compelling examples, which are shown below.

If you’re interested in learning more about GIS and social justice, these resources are a great place to start, although I find the inequity that the maps reveal to be very disheartening.

New Orleans
New Orleans, LA from Business Insider – http://www.businessinsider.com/most-segregated-cities-census-maps-2013-4?op=1

  1. The Revolution Will Be Mapped – This article gives an overview and describes some recent cases in which maps played a key role in highlighting discriminatory practices in the provision of public services.
  2. Redlining Maps –If you click on an area, especially those in red, you can see the disturbing (stunning, actually) area descriptions–circa 1930.
  3. Million Dollar Blocks – NPR highlighted the Justice Mapping Center’s work on visually representing incarceration rates and costs. Million dollar blocks are “areas where more than $1 million is being spent annually to incarcerate the residents of a single census block.” The maps are being used to identify areas for establishment of re-entry programs. You can check out data for Greenville County by zip code and census block here. Click on the state, then the county for details.
  4. Maps of Highly Segregated Cities – Each map provides a dissimilarity index. “A score above 60 on the dissimilarity index is considered very high segregation.” The symbology is very powerful. For New Orleans, you can clearly see the high elevation area along the river that geographer Richard Campanella refers to as the “white teapot.”
  5. Underbounding – I happened upon this term while doing a little research for the session. This is a practice by which certain groups (usually poor minorities) are excluded from annexation and associated services.
  6. Dividing Lines: School Districts in the US – This map shows how current educational funding practices limit fair access.
  7. Social Explorer – Our library is currently evaluating a subscription to Social Explorer, which should make it much easier to use the browser to map demographic data going all the way back to the 1790 Census. No desktop software required.

Highlights from the Future of Higher Education Forum

Image made available via CC license @ http://www.flickr.com/photos/feuilllu/5309422823/sizes/m/in/photostream/

Dan Cohen’s comments in the latest installment of the Digital Campus podcast prodded me to check out footage from George Mason University’s recent Forum on the Future of Higher Education.  I wanted to link to and highlight a few snippets that really resonated. A few notes:

*I have to admit that Dan jokingly referring to some of the discussion as being Jerry-Springer-like piqued my interest.  The discussion is actually very civil, and I appreciate Dan’s thoughtful skepticism.

*I haven’t watched all the footage. I saw individuals in the videos whose work I was familiar with (Dan Cohen, Bob Beichner, and Bryan Alexander) and tended to focus on their comments and responses to their insights.

*The video links in the titles below should take you to the appropriate spot in the conversation.  I make note of the time when the discussion shifts and you may want to stop and move on to the next snippet.

1. Context and Learning Environments:  (stop at 33:50) –  I like Dan’s focus on the university’s role in scaffolding and contextualizing information and reminding us that most learners need help with this.  Instructors as designers.

2. Measuring ‘Learning’ and Assessment:  (stop at 16:40) – Dan reminds us that focus on assessment (especially the easy to measure stuff) and learner analytics doesn’t paint a complete picture–not even close. He argues that a university also provides an environment for unexpected outcomes and ways of thinking—aspects of education that don’t lend themselves to tidy measurement.  This reminds me of a recent podcast by Freakonomics contributor Stephen Dubner in which he discusses lessons he uses everyday in his work with the professors who inspired the practice (even if they don’t remember the moment of inspiration!).

3. Student-Centered Instruction: (stop at 8:30) – Bob Beichner describes the SCALE-UP project at NC State, which utilizes problem-based-learning in large intro courses, and he shares how it’s working.  This design is being implemented at many schools across the country, including at nearby Clemson University. The model is adaptable to smaller classes.  Some classrooms would need some serious retrofitting to make this model possible, but it’s worth it.

4. Extending the Model Beyond STEM disciplines (stop at 1:04:45) – Bob shares how the SCALE-UP model can be used across disciplines. I really like how his example covers the entire learning cycle and mixes team and individual work.  Bryan Alexander compares technology use in the sciences and humanities.

5. MOOCs—It’s Complicated:  (stop at 41:35)  – Bryan provides a great overview of the different types of MOOCs, MOOC business models, and how colleges might leverage resources from MOOCs on campus. He also contextualizes several instructional technologies on the Gardner hype cycle.  Ah, the trough of disillusionment.


Robert Zemeckis and Ed Tech

I listened to an interview with Flight director Robert Zemeckis during my run last night.  This part (transcript from NPR’s Fresh Air) sure reminded me of our approach to educational technology sometimes.

CC licensed image from http://www.flickr.com/photos/vox/276882153/

DAVIES: Do you think digital technology has sort of fundamentally changed moviemaking, I mean, even in films that really don’t involve special effects?

ZEMECKIS: Oh, yeah. But that’s because every new – everything always did, from day one. I mean, you know, you can go back and see how, you know, we – they – in the final years of the silent cinema, where the art of cinema, of storytelling was so magnificent. And then when they invented the microphone and sound, everything got really static, and it all had to be reinvented again, and the same when color came in. And when the invented the steady cam, every movie had a chase up and down a staircase, you know.

So what we do with these technologies is we overuse them and we call attention to them, because they’re just so much fun to have. And then we learn how to use them in the way that all tools of cinema should be used, which is to make them invisible. So now I don’t think you can even tell when a director is using a steady cam. If he’s really good at his job, the camera movement won’t call attention to itself.

So, yeah, I think that, you know, some of the digital stuff that we’re doing now, especially in editing, I find that we’re – there’s editing for what I call no reason. You know, we just edit to edit. And I think we do that in films now because we can. But we’ll get that out of our system and, you know, and then something else will be there that’ll be the new technology of the month.

The Flipped Classroom: Traps and Before the Lecture

Take a minute to reflect on some of your biggest teaching fails.  Many of my in-class fails started this way:

“Today I’m going to talk about . . . “

No context.  No student experience on which to build.  Plummeting energy in the room (including my own) . . .

Are we on our way to reproducing this experience online with the flipped classroom?

As I read more examples about how instructors are implementing flipped classrooms, I’m actually very encouraged that this can be done to optimize class time together for deeper student learning. Derek Bruff has a great post and supporting visuals that describe the flipped approach and more importantly the inherent traps.

“The lecture video portion of the flipped classroom approach gets a lot of attention because it’s the piece that involves shiny new technologies, but it’s the pedagogy that drives the flipped classroom, not the technology.  If all you’re doing is posting lecture videos online, you’re not flipping your classroom and, more importantly, you’re missing out on the learning opportunities the full model provides.”

A complex visualization, such as this one from the online comic xkcd can serve as a first exposure or student experience.

I want to build on this idea of traps inherent in the flipped system. Assuming ‘first exposure’ = ‘content delivery’ makes the trap potentially more insidious.  This assumption is likely to lead to mimicking the mistake above, only this time, online.  In this case, it’s actually worse. The instructor is far removed from the vacant stares of the students and unable to make mid-class corrections (like asking questions and bringing student experience back to the forefront).  A misunderstanding of the flipped design, coupled with technology, not only encourages but hides design flaws—a dangerous combination.  To overcome these challenges, we need to consider important steps that come before ‘first exposure’ or rethink what first exposure really means (something other than content-heavy lecture).

So what comes before the online lecture?  I’ll start with an in-person example. I co-led a GIS in the Humanities workshop with Sean Connin (Trinity University) and Alex Chaucer (Skidmore College) in which Alex facilitated a discussion about several key concepts in Yi-Fu Tuan’s Space and Place.  His session was a great example of designing around the ‘lead-with-content’ trap. Alex could have lectured about the concepts, but instead, he asked us to spend a few minutes visiting the streets of our childhood using Google Earth street view as well as the interactive Wilderness Downtown website. He posed several questions for reflection before the discussion and introduction of new concepts from the book. The experience was powerful and led to deeper understanding. The brief activity helped us contextualize and draw on previous experience (and emotion!), so the subsequent lecture and discussion had purpose. Alex not only provided a compelling hook, but the design helped us situate new ideas within previous experiences because he had so effectively activated our prior learning.

As we create flipped experiences for students, we’re bound to have a laser-like focus on the quality of the recorded lectures, making it easy to lose sight of the importance of contextualizing those lectures—either within the lecture itself or with activities beforehand. The best pre-lecture activities leave students perplexed and wanting to know more, but also help them situate what’s to come with what they’ve already learned.  Maybe the experience unravels a misconception. Perhaps it oversimplifies a complex topic and encourages the student to develop probing questions. I’m a big fan of Marilla Svinicki’s (1987) call for using the Kolb Learning Cycle as a model for designing instruction.  In that model, experience and reflection precede concept development (often a big component of lecture), so the model serves as a good visual reminder to help us avoid traps.  As her article points out, experience can come in many forms (reading, simulations, observation, evaluating a visualization, etc.).  Careful design, with balanced guidance, is key to purposeful exploration, rather than aimless wandering.

The RadioLab podcast is another great example of this design, and they’re just using audio! Jad Abumrad and Robert Krulwich are masters at using stories to develop complex ideas, skillfully weaving process and content.  I mapped their show on randomness (stochasticity) onto the learning cycle.

Radiolab podcast mapped onto the learning cycle.

I doubt they had the learning cycle in mind when designing the show, but their online “lecture” about randomness doesn’t really begin until after they’ve provided the listener with an experience (a story of the two Lauras) and an opportunity to reflect on the story.  They even throw in an additional coin flipping experience to boot before moving on to the idea that, “Real randomness when you see it, just doesn’t feel random enough.“

I think it’s somewhat natural for teachers to activate experience and provide opportunities for students to reflect and situate new ideas in the physical classroom.  I’m not sure this is so natural online.  So as we look at the flow of the ‘flipped classroom’ let’s add an element right at the beginning—student experience and reflection. This way, passive information reception isn’t the students’ first exposure.  When I think about the flipped classroom movement, I’m both wary and excited. There are some serious traps; however, executed with design at the forefront, the opportunities are vast.  We certainly have our work cut out for us.  Not only do we have to provide information online in a compelling way, but we have to design student experiences that make the content meaningful. Oh, and then there’s the business of designing in-class activities.

Feedback welcome!

Thanks to Diane Boyd for her comments on the draft of this post.  Many of the ideas in this post gelled as a result of preparing for a conference presentation with colleague Jeremy Donald.  A post-presentation debrief over spicy Thai food helped even more.  Thanks Jeremy!

Update:  After authoring this post, I caught up with my feed reading and realized Dan Meyer had also emphasized putting something BEFORE the online lecture to activate students’ intellectual need.  I’m happy to be on the same page as Dan Meyer and others (see comments), even if it means my observation isn’t as original as I first thought!

Svinicki, M. D., & Dixon, N. M. (1987). The Kolb model modified for classroom activities. College Teaching, 35(4), 141–146.

YoU(lysses): A Better MOOC?

Reading James Joyce’s Ulysses has been on my bucket list for several years; however, everything I’ve heard and read about the novel has left me hesitant to embark on the journey alone.  Now I’ve found some help.  Check out the Modernist Versions Project’s Year of Ulysses.  The website provides a schedule for reading, serial chapter releases of the original, online lectures, and periodic twitter discussions of the book.  So far, I’ve been keeping up with the reading and lectures, and I’ve found it really useful to have some additional background (and help!).  I initially read the PDF version of the releases but later found it more productive to read the free iBooks version, since it has an inline dictionary.  The reading pace outlined on the site is very reasonable, so I don’t have to abandon my other, lighter reading. This seems like a great model and somewhat more interactive than a traditional MOOC.

I’ve also enjoyed Jenny Colvin’s blog posts about her experience reading Ulysses. Jenny was kind enough to gift me some audible credits to get the audio version of the book.  Thanks Jenny! My plans are to revisit chapters I’ve read on a long run (once my achilles heals—kind of ironic).

Some bass-driven inspiration:

Nick Cave’s Night of the Lotus Eaters
Franz Ferdinand’s Ulysses

Image Credit: http://www.flickr.com/photos/48957186@N06/6940825627/

Designing In-Class Activities in the Flipped and Blended Learning Classroom: An Example

Overview:  This post provides information about blended learning / flipped classroom modules that we developed for classes that involve creating and analyzing maps.  I briefly discuss the reasoning behind our design as well express my hope that more of the dialog surrounding blended learning and flipping the classroom will focus on resources that help guide the design of effective in-class activities. The modules can be found at https://sites.google.com/a/trinity.edu/acs_grant_gis/home .

There’s been a great deal of chatter recently about the “flipped classroom” and “blended learning”.  If we’re to have deeper dialog, I think it’s important to note that the real conversation is about design. Effective teachers strive to design environments (whether physical or digital) that set the stage for in-class interactions that are rigorous, robust, analytical, dynamic and lead to deeper learning.  Online components are a great resource to help optimize time together; however, the design process is much more complicated than simply inverting in- and out-of-class activities. I’m grateful that these new terms have the potential to inspire a renewed focus on assignment and course design, but the idea behind the flipped classroom is hardly new. Much of our work with faculty at the Center for Teaching and Learning has revolved around designing strategies that help move in-class activities away from the dissemination of information towards more active student analysis and synthesis. Instructors have been doing this long before these terms became popular.

Much of the recent discussion seems to be about moving current lectures online (and the technology to enable this), with class time being used for having students “work in groups to solve problems”—almost as an afterthought.   I’m hoping the dialog will continue to evolve to include more discussion about how to design these in-class sessions more effectively so that students do more than just work in parallel or share algorithms.  Designing these in-class activities is difficult and where the rubber truly meets the road. Simply putting students in groups (after they’ve watched a lecture online) to solve poorly designed problems is a recipe for failure and frustration.  Flipped interactions which hinge on poorly designed in-class sessions are unlikely to promote deeper conceptual understanding and realize the full potential of supplementing classes with online resources.

Just a few resources for designing better in-class problems that I’ve found to be helpful:

Now it’s time to put my money where my mouth is. Through a grant from the Associated Colleges of the South, I’ve been working with Jeremy Donald at Trinity University to design blended learning modules that can be used in any course in which analyzing and creating maps plays and important role. Here are a couple pertinent FAQs from the project:

Q: Are you just trying to move lectures out of class?
A: Not at all. We’ve attempted to do more than just move lectures and GIS “how-tos” online.  You’ll notice in the videos that our focus isn’t so much on tools, but more on concepts. Our goal is to help develop an environment in which students can begin to think more critically about maps and visualization (before they dig into the nuts and bolts of creating maps).   We’re hoping that by introducing students to some concepts and questions outside of class, in-class time can be used to amp up the opportunity for analysis and synthesis.

Q: What’s guiding your design?
A: We are both Kolb Learning Cycle junkies and have been impressed with the results of using Kolb’s Learning Cycle as an assignment and course design framework. Kolb’s paradigm involves a cycle of exploration, reflection, conceptualization, and application.  Our experience is that leading with exploration (whether it be a lab, open-ended question, computer simulation, webcast, etc.) engages and helps students build a framework on which to situate new experiences with prior knowledge, establishing a path towards deep understanding.  Our goal is to move some of the stages of the cycle online to free up class time for application and synthesis.

We’d love to know the answers to the following questions:

1) How’d we do?  How can the modules be improved?  Can you use these in your courses?
2) What principles and resources have you found helpful in designing meaningful in-class problems for students to attack?  How do you design and utilize online environments to set the stage for more meaningful in-class interaction?

Image sources:  http://www.flickr.com/photos/98715075@N00/410132468/ and http://www.flickr.com/photos/37113212@N08/5308079192/